Code
```{python}
print("Hello World!")
1+1
```Hello World!2How does one go from a linux installation with python3 and RStudio to rendering .qmd files with python and pyMC code chunks? In this blog post I document the steps I took to get these things set up.
First, within RStudio select a default python version for RStudio (and un-check ‘Automatically activate project-local Python environments’); and for good measure create a keyboard shortcut to insert python code chunks (I opted to remap Ctrl+Alt+P from ‘Re-Run Previous Code Chunk Execution’).
RStudio requires the reticulate package to execute python code chunks; it can be installed with install.packages:
```{r}
install.packages("reticulate")
```
In order to render python code chunks quarto requires the jupyter python package. It can be installed with:
```{bash}
python3 -m pip install jupyter
```
To check if quarto thinks it’s set up to render python chunks:
#| echo: fenced

quarto check jupyter
Did it actually work?
```{python}
print("Hello World!")
1+1
```
Hello World!2Apparently so.
Which python packages will be needed to actually use pyMC? Here are the ones I installed in advance:
It would make too much sense to install python packages by calling pip from a python chunk, like so:
```{python}
pip install pymc bambi arviz kulprit pymc-bart preliz nutpie numpy scipy pandas matplotlib seaborn nose pydot
```
Unfortunately reticulate doesn’t support this; but note that this chunk will run properly when rendered, as you will recall that quarto renders this with the jupyter python package. Reticulate could be used, e.g. reticulate::py_install("pymc",pip=TRUE), but nothing beats the good old command line:
```{bash}
python3 -m pip install pymc bambi arviz kulprit pymc-bart preliz nutpie numpy scipy pandas matplotlib seaborn nose pydot
```
The following outdated packages (python3 pip list --outdated) were updated:
```{bash}
python3 -m pip install pymc numpy scipy matplotlib matplotlib-inline -U
```For this example we will recreate model 4.1 from the Statistical Rethinking text, as demonstrated in the pymc resources:
Setup the python libraries:
import arviz as az
import matplotlib.pyplot as plt
import numpy as np
import pandas as pd
import pymc as pm
import scipy.stats as stats

from scipy.interpolate import griddata
WARNING (pytensor.tensor.blas): Using NumPy C-API based implementation for BLAS functions.Readers who have already read Statistical Rethinking may recall that the Howell1 dataset contains demographic data (height, weight, age, gender) from Kalahari Kung San people. Load the dataset:
d = pd.read_csv("Howell1.csv", sep=";", header=0)
d2 = d[d.age >= 18]
A mathematical description of model 4.1 (\(h_i\) is the height of participant \(i\)):
\[ \begin{align} h_i &\sim \operatorname{Normal} (\mu, \sigma) \\ \mu &\sim \operatorname{Normal} (178, 20) \\ \sigma &\sim \operatorname{Uniform} (0, 50) \\ \end{align} \]
This model was translated into pyMC as:
with pm.Model() as m4_1:
    mu = pm.Normal("mu", mu=178, sigma=20)
    sigma = pm.Uniform("sigma", lower=0, upper=50)
    height = pm.Normal("height", mu=mu, sigma=sigma, observed=d2.height.values)

with m4_1:
    trace_4_1 = pm.sample(1000, tune=1000)
Using arviz to summarize the results; first the trace plot:
az.plot_trace(
  trace_4_1,
  show="FALSE"           # don't show backend function
)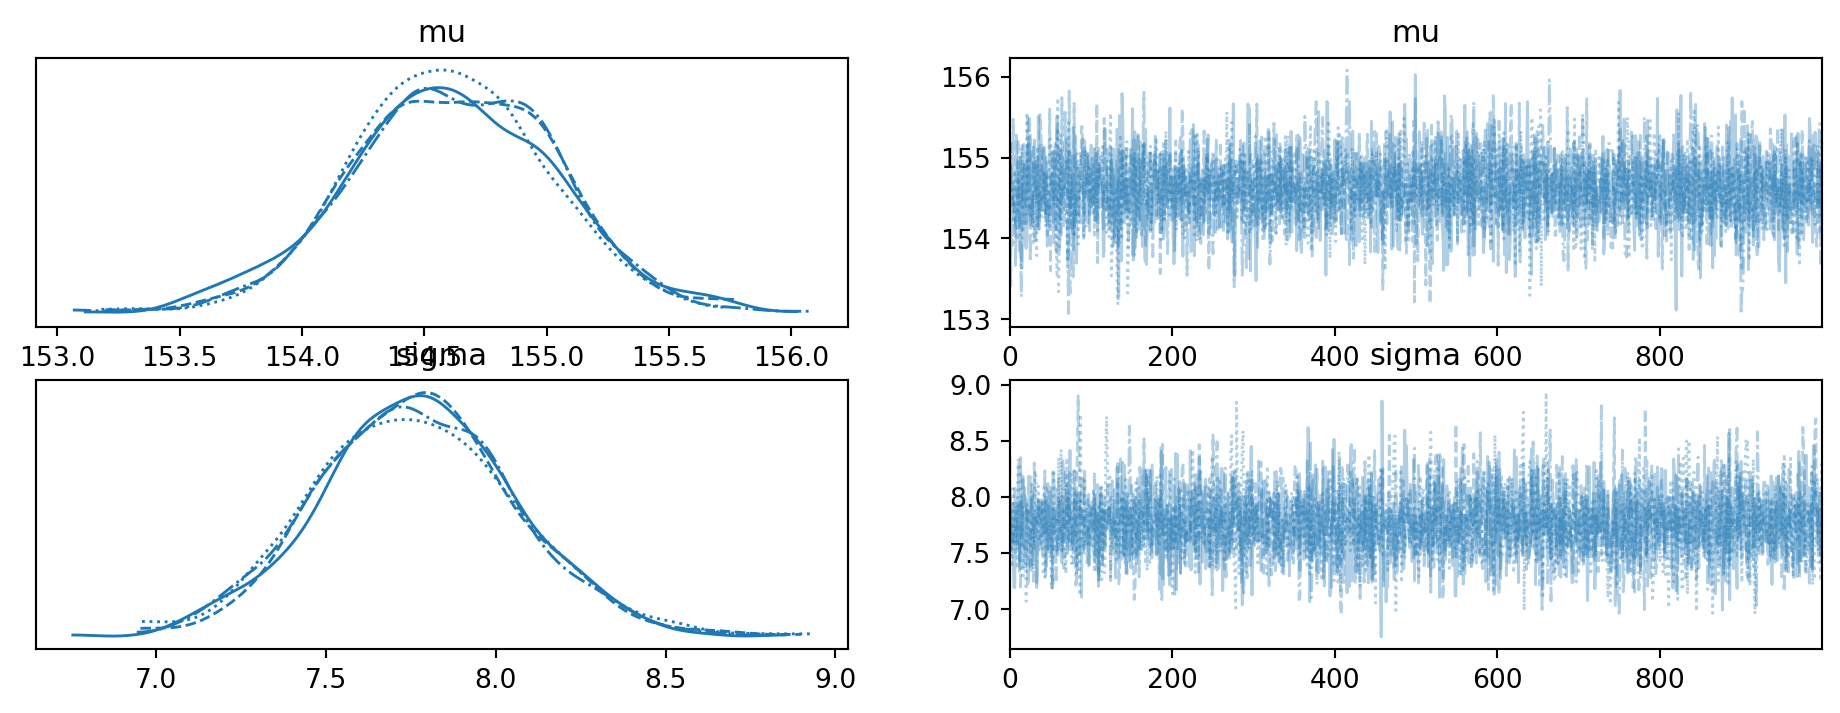
array([[<Axes: title={'center': 'mu'}>, <Axes: title={'center': 'mu'}>],
       [<Axes: title={'center': 'sigma'}>,
        <Axes: title={'center': 'sigma'}>]], dtype=object)
And a data table summarizing the results:
az.summary(trace_4_1, round_to=2, kind="stats")| mean | sd | hdi_3% | hdi_97% | |
|---|---|---|---|---|
| mu | 154.61 | 0.42 | 153.83 | 155.38 |
| sigma | 7.77 | 0.29 | 7.23 | 8.32 |